How to Manage Your Dashboard
Modified on: 2025-10-24 11:08
TABLE OF CONTENTS
Introduction
- Hotel Account Dashboard provides a single place for you to review consolidated performance statistics from your account.
- You're in control of what type of data and format to view it in. It’s easier to use dashboards instead of a single report to arrange or group your account’s data in a meaningful way.
Dashboard Features
Overview
The Dashboard provides a comprehensive overview of performance, including:
- KPI view for key metrics
- Chart view with multiple visualization options
- Metasearch price competitiveness view
- Activity list view
It also allows you to analyze performance by applying filters such as hotels, activities, channels, markets, and date range within this hotel account.
Notes: The dashboard download will be enabled in further release scope.Features
1. Performance Scope Selection
- Click on [Dashboard] in the left hand navigation menu.
- You can select by hotel or activity name to view the performance details by using the two dropdown lists on the top left side.
- By default, all hotels and activities are selected.
- You are able to apply activities/hotels/channels/markets filters to get your wanted performance data.

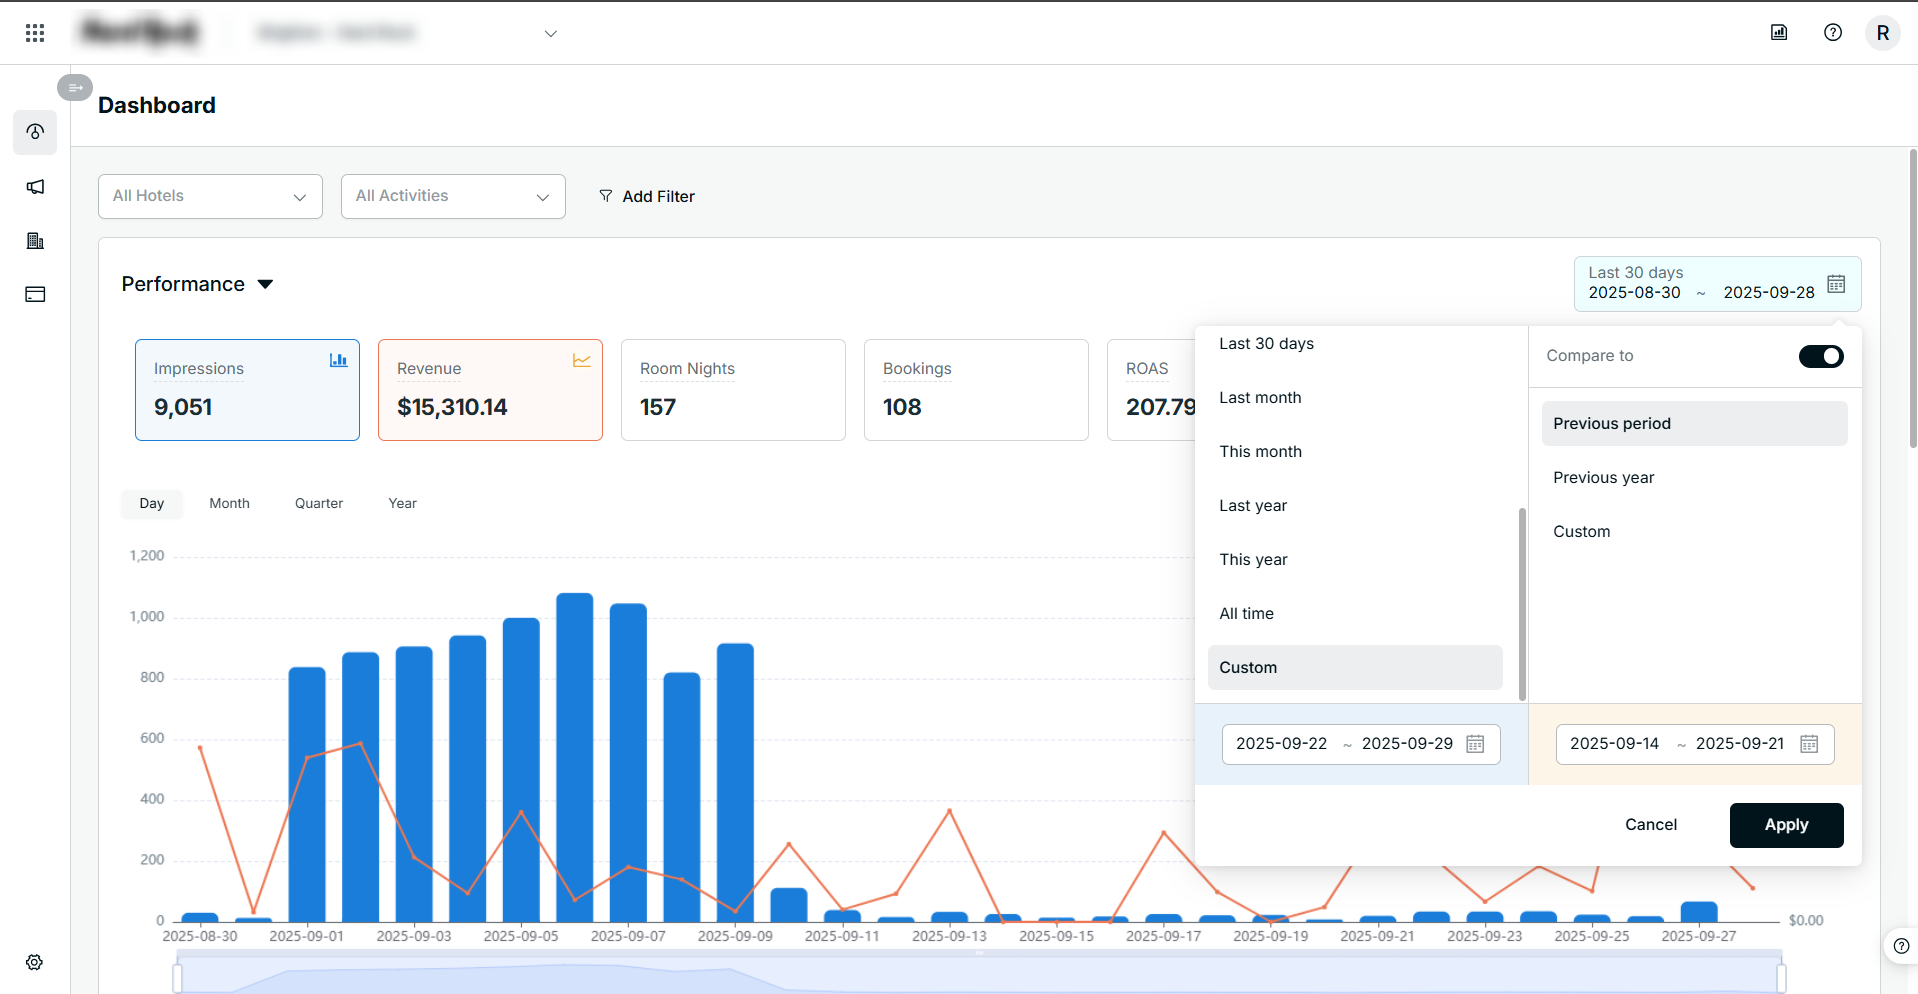
2. Powerful Date Picker
- You are able to use the date picker to view the performance by
- Pre-defined time.
- Applying custom date selection.
- Applying comparison function.
3. KPI & Combo Chart
- You are able to select max two metrics KPI and generate the combo chart.
- Hovering over the chart icon on top right of the KPI card to switch between line/bar view.
- You are able to scroll the KPI board to go through and select the metrics you like.
- You are able to change to any metric by hover the 3 dot on top of the KPI card and choose a chart type and replace. the previous metric which has this chart type selected.
Notes: There are 4 aggregated time types for chart view: Day, Month, Quarter and Year.

4. Channel & Market View
- You are able to visualize the performance by channel and market map view.
- You are able to use the left side filter to switch the metrics view type.
- You are able to use the right side filter to switch the date range.
- For market map, you are able to use the full screen to view the performance.
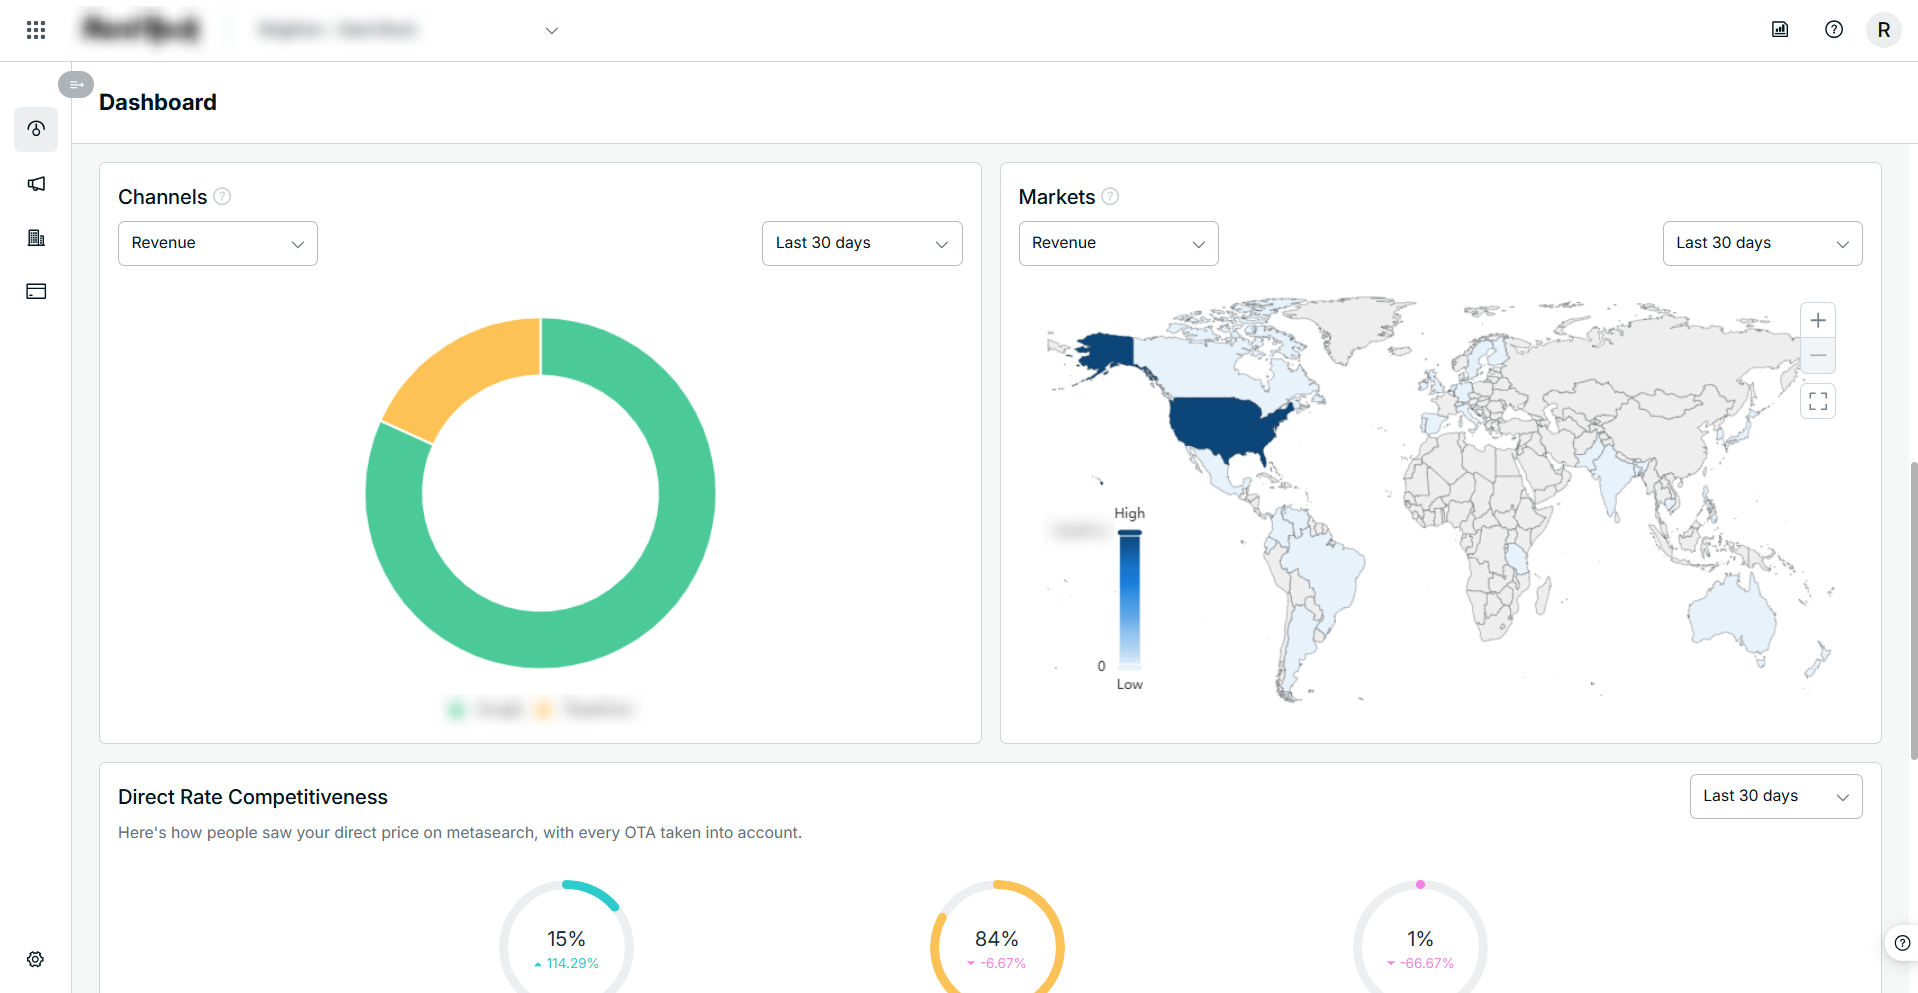
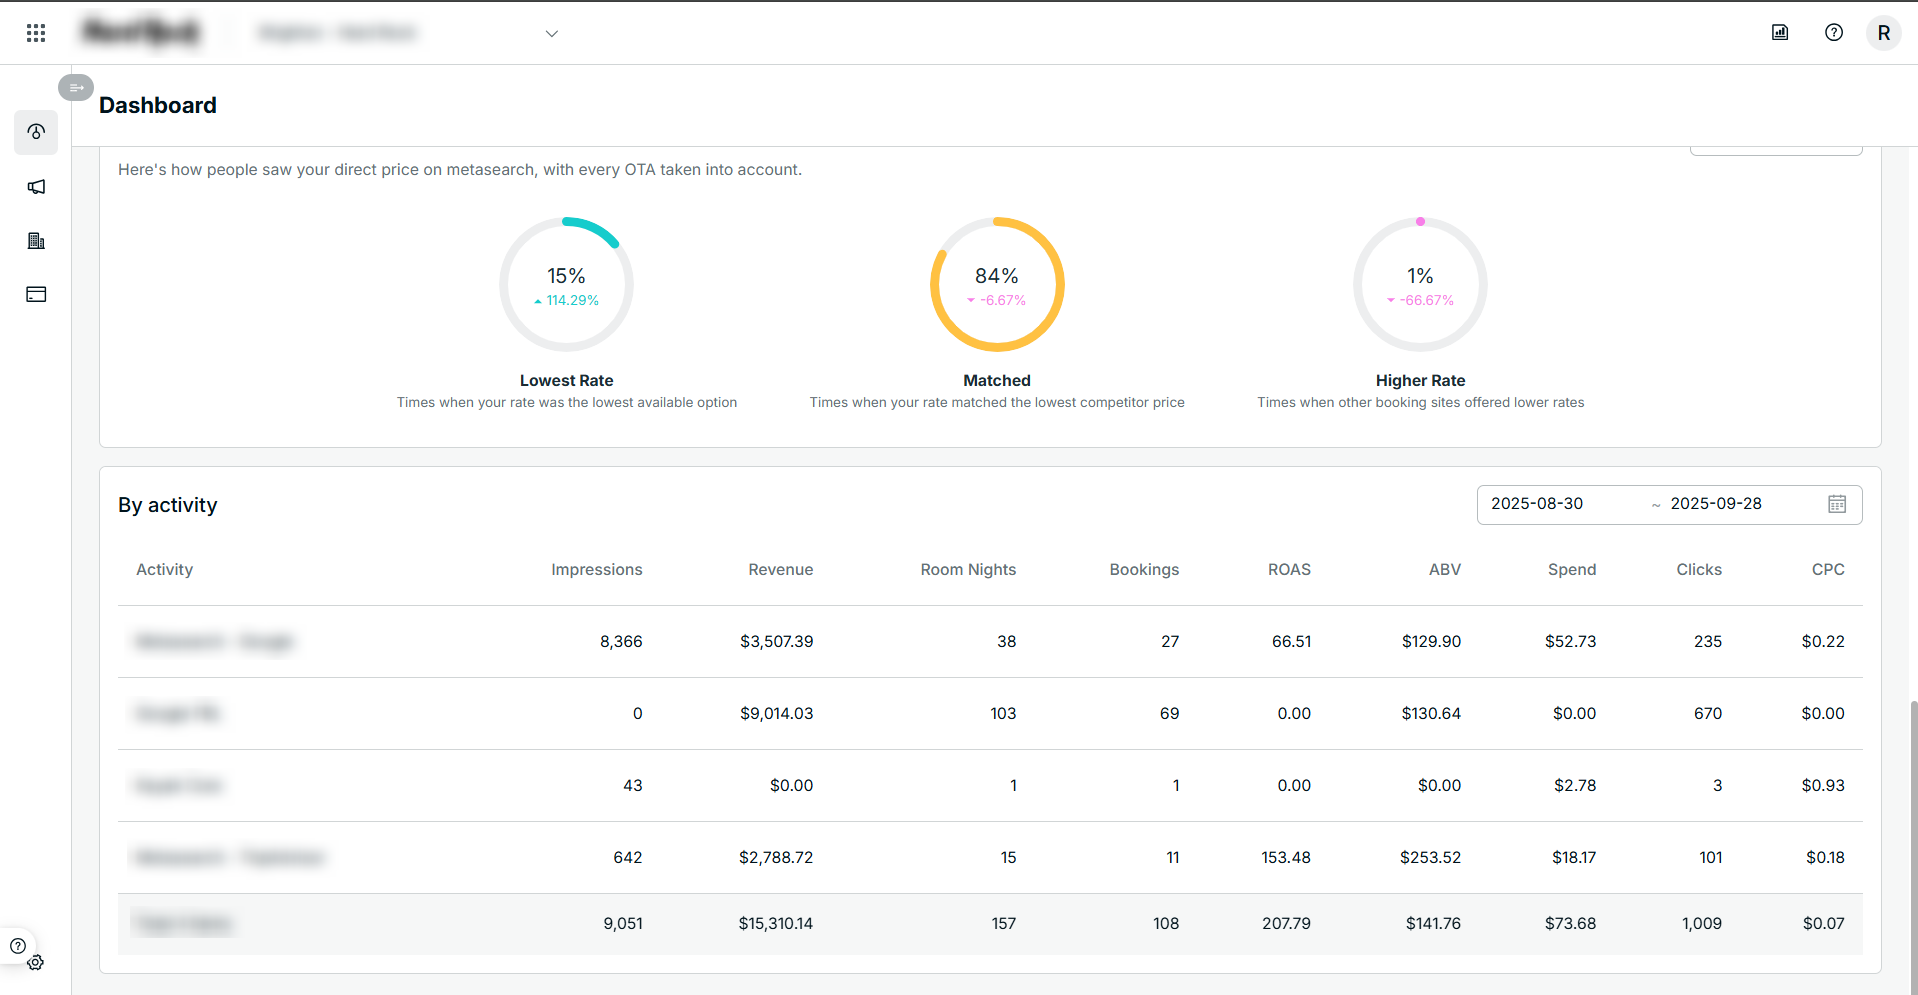
5. Direct Rate Competitiveness
- You are able to know your meta search price competitiveness to other OTA channels.

6. Perfomance by Activity
- You are able to view all metrics performance by activity list.
7. Dashboard Download
- Coming soon.
Did you find it helpful? Yes No
Send feedbackSorry we couldn't be helpful. Help us improve this article with your feedback.